All six stations had less than a six minute average non-EMS response time from January-October 2014.
One of the engines has a questionable average response time.
The Los Angeles Fire Dept., or LAFD, was under heavy criticism for everything from the lack of diversity in the force to nepotism to response times. Since becoming Los Angeles’ mayor, however, Eric Garcetti has started to reform the department by, in part, bringing in a new chief, putting FireSTATLA into place and having response time data posted online.
Are these efforts enough to improve response times? What or who is to blame for the higher response times? Some may say the former is too early to tell, especially because some of Garcetti’s reform initiatives were just announced and rolled out in Oct. of this year. The answer to the latter varies, slightly, depending on who answers the question.
Along The Line looked at two data sets to see whether response times – the difference between the on scene time and the en route time – in the wealthier, western portion of the City of Los Angeles were better than those in the poorer, eastern portion of Los Angeles, or to at least get a general trend. It will be up to the reader to make his or her own determination. The first set of response time data was obtained from the LAFD by a Public Records Act request. The data was then narrowed down to find the average response times of six engines – three from stations in the west and three from stations in the east – for non-EMS calls that went through the 911 system during the third quarter of 2014. This data is sorted by apparatus, such as by engine engine. The second response time data set is the FireSTATLA data that is published on the LAFD’s website. This data is sorted by station, so Along The Line looked at the six stations’ non-EMS average response times from Jan.-Oct. 2014. (Oct. was the latest month available at the time of publishing.) The six stations are the stations where the six engines examined in the first data set are housed.
The six engines are engines 2, 25 16, 19, 269 and 71; the six stations are 2, 25, 16, 19, 69 and 71. The first three engines and stations are in the eastern part of the city while the second three are in the western part of the city. On the map, the locations where Engine 2 was dispatched are in red, Engine 25 in purple and Engine 16 in light green.
<It is important to note that the samples reviewed for this article are not representative of the entire city, nor are they representative of the entire year. The data obtained via the Public Records Act does not have dates nor does it show if the engine was the first, second, etc. to arrive on the scene.
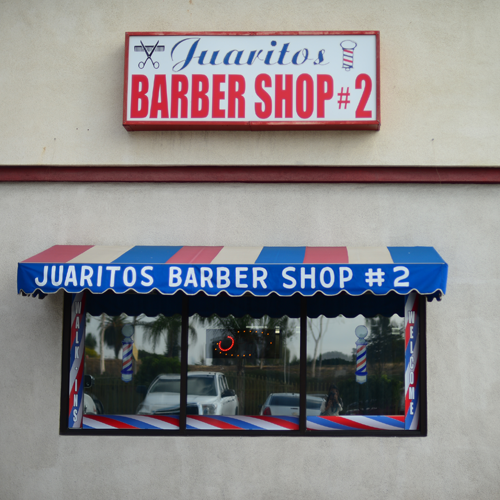
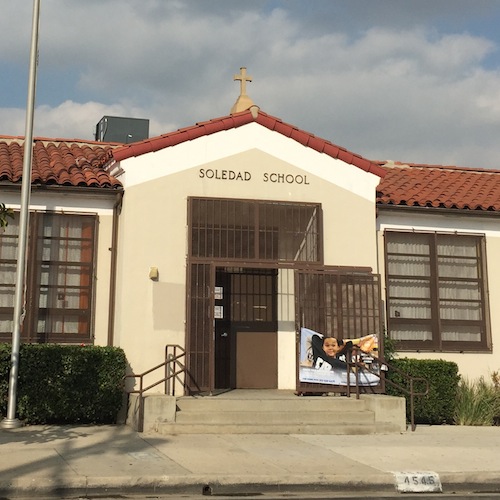
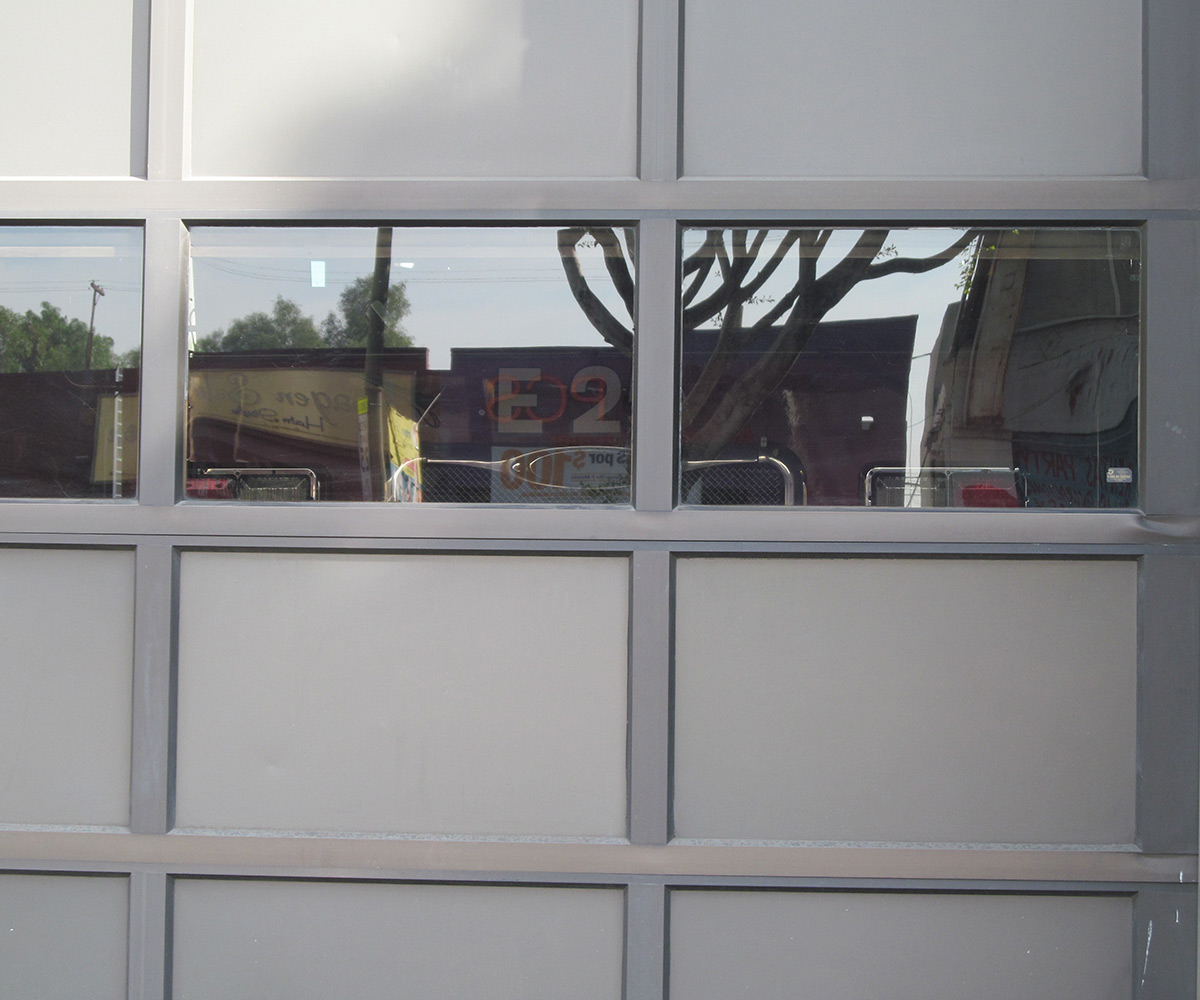
According to the data obtained via request, Engine 2 had an average response time of 5 minutes and 7 seconds for non-EMS calls in the third quarter. The longest response time was 21 minutes and 8 seconds, which was the time it took to get to what the fire dept. calls a “rubbish fire” on the Southbound 5 Freeway at the transition to the Eastbound 10 Freeway. The shortest response time was 1 minute and 9 seconds to a “rubbish fire” located at 149 N. Soto St. According to the FireSTATLA data obtained on the Internet, the station’s 2014 average response time, through Oct., for non-EMS calls within the district in which the fire station is located, is 4 minutes and 8 seconds. The FireSTATLA metrics show that the station is responsible for a 2.93 square mile area.
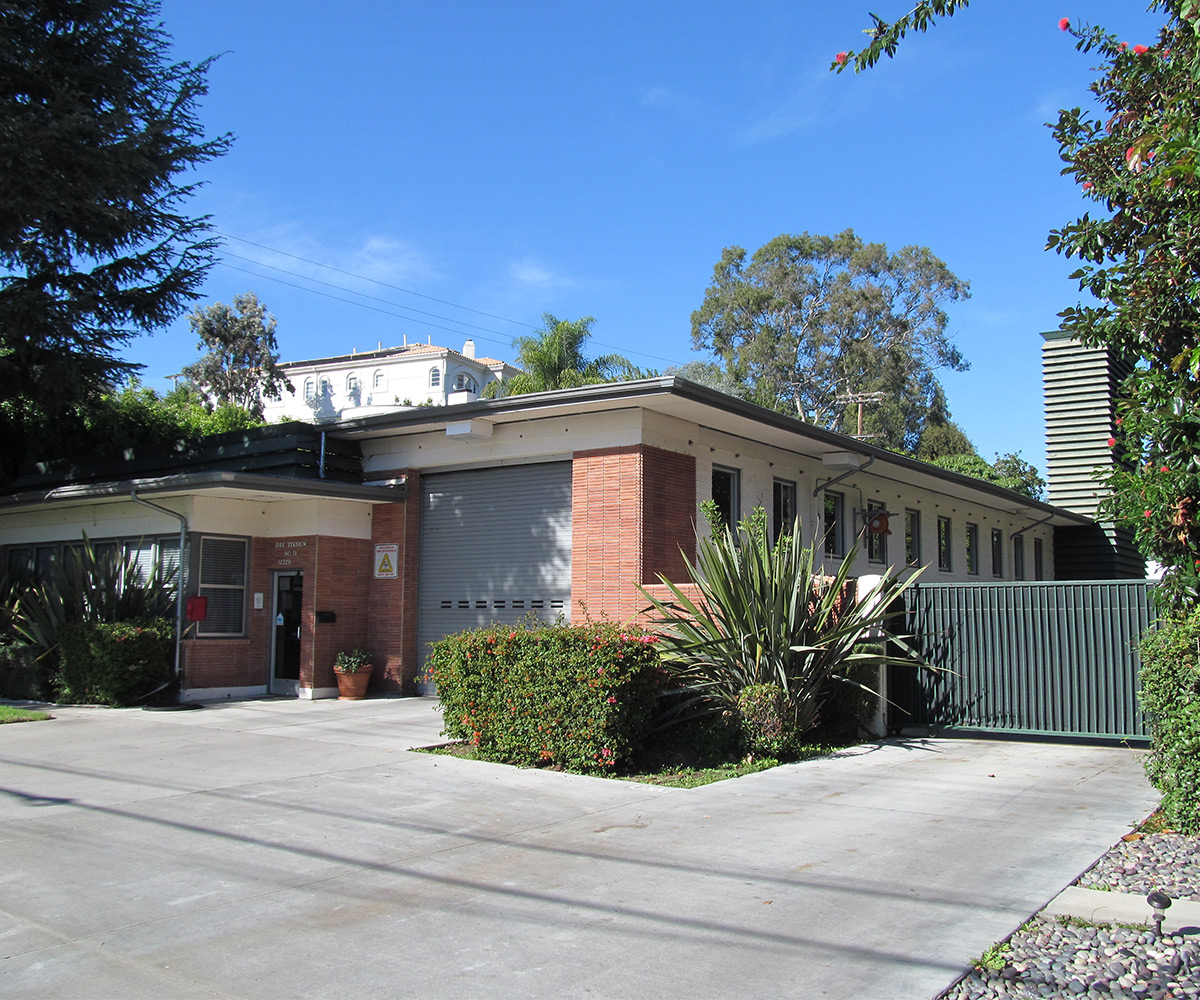
The requested data shows that Engine 25 had an average response time of 12 minutes and 26 seconds. That number is inflated by what the information showed to be a 5 hour and 58 minute response time to what the LAFD calls a “structure fire,” located at 3359 E. Eighth Street. That number could have been a type-o or some sort of error, such as a delay in pushing a button. Nonetheless, it is the figure provided by the Fire Dept. If that call is removed, however, Engine 25’s average response time decreases to 4 minutes and 12 seconds, which is more in line with the station’s year-to-date average of 4 minutes and 45 seconds, the time shown in the online data. That data shows the coverage area for Station 25 is 2.29 square miles.
When asked about the 12 response time average in a phone interview, Peter Sanders, director of public information for the Los Angeles Fire Dept., wanted to know how the average came out to be 12 minutes and wanted to make sure Along The Line knew response time data was posted online.
He then responded by saying, “We don’t have our data broken up by apparatus and 12 minutes is certainly not correct…if you look at the individual fire station districts, we’re not looking at individual pieces of apparatus, we’re looking at…response times within those fire stations’ districts…we’re looking at the time the first unit got to the call.”
Sanders said the response time data posted online “has been triple validated.” The LAFD’s “Civilian statistical analysts,” conduct one step and private-sector analysts from two different companies conduct the other two steps. One of the two is Dr. Craig Uchida, president of Justice & Security Strategies, Inc.
If included, the five-hour response is the longest response time for the quarter, but if it is removed, the longest response is 26 minutes and 20 seconds, which occurred while the engine was en route to a “rubbish fire” located at 1032 S. Fresno St. Engine 25’s shortest response time, two seconds, was attained while it was going to a “tree fire” associated with the address 3119 E. Garnet St.
Engine 16’s average response, as found by using the requested records, was 4 minutes and 22 seconds. The engine’s slowest response time was to an “automobile fire” at 2940 E. Fowler St. The transit time for the call was 16 minutes and 30 seconds. The fastest response time, 1 minute and 5 seconds, was to a “bells ringing – fire alarm” call located at 2448 N. Eastern Ave. The station’s 2014-to-date average response time for non-EMS calls is 5 minutes and 13 seconds. The information on the Internet shows that Station 16’s coverage area is 2.44 square miles.
West Los Angeles’ Engine 19 had an average non-EMS response time of 5 minutes and 48 seconds based on the data requested from the Fire Dept. The longest time it took getting to a call was 43 minutes and 45 seconds. That was for a “hiker down” call, however, associated with the address 15600 W. Sunset Blvd. in the Temescal Canyon area of Pacific Palisades. Its shortest response time was three seconds, which was to a “reported smoke” call located at 12144 W. Sunset Blvd. The station’s year-to-date response time is 5 minutes and 55 seconds, according to the triple validated data. The data also shows, however, that Station 19 covers an area of 14.99 square miles.
Engine 269, which is housed in Station 69, had an average response time of 8 minutes and 52 seconds. That is because there two calls that had a response time in the 40 minute range – one was a “hiker down call” and the other was a “natural gas leak” – along with two responses that were 19 minutes and change. The “hiker down” was likely the same call that took Engine 19 the longest because the “911 time stamp” is the same – 10:01:47 a.m. It took the longest to get to – 46 minutes and 59 seconds. The shortest response time was three seconds to a “structure fire” at 15215 W. Sunset Blvd. Station 69’s average 2014 response time through Oct. is 5 minutes and 5 seconds. Its average time is lower than Station 19’s average time, but its coverage area – 5.12 square miles – is smaller, according to the data on the Web.
Engine 71’s has an average response time of 5 minutes and 33 seconds for non-EMS calls in the third quarter. The greatest response time was 11 minutes and 59 seconds to a “snake rescue” at 10206 W. Cielo Dr. The smallest response time was four seconds to a “flooding incident” at 10452 W. Sunset Blvd. This could have been the water main break that flooded UCLA’s campus over the summer, but because the data provided via Public Records Act request does not include dates, it is not known for sure. According to the Internet data, the station has a 2014 average of 5:38 through Oct., only five seconds more than the engine’s average for the third quarter. It has area of coverage is 5.11 square miles, according to the same data.
One reason Engine 71 may have had a shorter response longest response time than Engine 269 is that it did not have to respond to any “hiker down” incidents.
According to the data obtained via a Public Records Act request, Engine 2 responded to 57 non-EMS calls in the third quarter. Engine 25’s call volume is 51 when the five-hour response time is included and 50 when it is not. Engine 16’s call volume is 29.
The same data showed that Engine 19 responded to 72 calls during the same time period; Engine 269 responded to 45 calls and Engine 71 responded to 25 calls.
There is no way to compare these figures to the LAFD’s goals because Sanders, the director of public information, said the department does not have a set goal. He said that is because “There’s no way we can institute a city-wide goal, given the different geography, topography and traffic conditions throughout the city at various times during the day.”
Jimmy Blackman, a spokesman for United Firefighters of Los Angeles City, or UFLAC, said by phone, however, “The national standards, which all fire departments are supposed to strive for call for a goal of six minutes in response times....” All of the stations’ year-to-date averages are below six minutes. Engines 2, 16, 19 and 71 are under as well. Engine 25 is under only when the five-hour response time is omitted. Engine 269 does not meet the six-minute goal.
UFLAC, which represents personnel from the rank of captain and below, including dispatchers and pilots, believes there is a one-word answer to what is needed to improve response times. Blackman, said that word is “staffing.”
“Over the past five years, the Fire Dept. has lost over 600 people and during that same time period, we’ve only gained 58 new bodies, with the recruit class that graduated a few months ago,” Blackman said.
He also said that during the period of budget cuts, the City eliminated “a couple hundred positions from the Dept.”
Los Angeles’ executive branch of government starts off the answer differently when asked about Garcetti’s plan to improve response times. Yusef Robb, a spokesman for the mayor, said by phone, “FireSTAT just launched…the first step to ensure we have reliable data against which to compare ourselves. We can’t know if we’re improving if we’re not benchmarking ourselves against something.” Robb added that three groups were involved with creating what he called “a firm baseline.” He also said this was created “over the last few months.”
Robb said that “with the FireSTAT process, we are measuring the Department’s performance against that baseline and are looking for patterns, looking for places where improvement’s needed, looking for places that are performing exceptionally, so that we can take a look at what they’re doing and apply those best practices to other parts of the Department.”
The spokesman also said that the LAFD is introducing a new technology called automatic vehicle location technology. He said it “will work with our dispatch system, so that the closest available fire unit or medical unit is dispatched to an emergency.” That is rather than sending the engine or ambulance that covers the area of the incident, but is farther away.
 Engine 25 in Station 25. (Photo by Max Schwartz)
On the staffing issue, Robb said, “We are adding more firefighters. We have started the first hiring in our Fire Dept. in five years. The first couple of academy classes have gone through and we have more that we’ve budgeted for in our budget for the next year….”
Blackman confirmed that the funding is in place, but said the creation of the next class is taking a long time. He said that there is still no next drill tower, or academy, class. “The issue has been working with the personnel dept. and basically getting the drill tower classes up and running again,” according to Blackman.
He explained that 70 start in the class, but to UFLAC’s knowledge, the personnel dept. “is still doing the background checks and still finalizing things. They have not completed the process to identify the final list of people that will be in the drill tower….”
On FireSTAT, Blackman said that UFLAC “supports the use of FireSTAT and any metrics possible that can help with our deployment with the ultimate goal of cutting response times.” He did go back to, however, needing people.
Los Angeles City Councilman Mitchell Englander, 12th District, is chairman of the Council’s Public Safety Committee. He was the one who wanted to develop FireSTATLA.
Doug Tripp, his legislative director, said in a phone interview, said the councilman “wants the process [of forming the drill tower class] to moves as expeditiously as possible,” and added that the councilman helps the personnel dept. get the resources it needs.